


Abstract
Binary black hole (BH) central engine description for the unique blazar OJ 287 predicted that the next secondary BH impact-induced bremsstrahlung flare should peak on 2019 July 31. This prediction was based on detailed general relativistic modeling of the secondary BH trajectory around the primary BH and its accretion disk. The expected flare was termed the Eddington flare to commemorate the centennial celebrations of now-famous solar eclipse observations to test general relativity by Sir Arthur Eddington. We analyze the multi-epoch Spitzer observations of the expected flare between 2019 July 31 and 2019 September 6, as well as baseline observations during 2019 February–March. Observed Spitzer flux density variations during the predicted outburst time display a strong similarity with the observed optical pericenter flare from OJ 287 during 2007 September. The predicted flare appears comparable to the 2007 flare after subtracting the expected higher base-level Spitzer flux densities at 3.55 and 4.49 μm compared to the optical R-band. Comparing the 2019 and 2007 outburst lightcurves and the previously calculated predictions, we find that the Eddington flare arrived within 4 hr of the predicted time. Our Spitzer observations are well consistent with the presence of a nano-Hertz gravitational-wave emitting spinning massive binary BH that inspirals along a general relativistic eccentric orbit in OJ 287. These multi-epoch Spitzer observations provide a parametric constraint on the celebrated BH no-hair theorem.
Export citation and abstract BibTeX RIS
1. Introduction
The International Pulsar Timing Array (IPTA) consortium aims to inaugurate the era of nano-Hertz (Hz) gravitational-wave (GW) astronomy during the next decade (Perera et al. 2019). This is expected to augment the already established hecto-Hz GW astronomy by the LIGO–Virgo collaboration (Abbott et al. 2019) and the milli-Hz GW astronomy to be established by space-based observatories in the 2030s (Baker et al. 2019). Massive black hole (BH) binaries, emitting nano-Hz GWs, are the most prominent IPTA sources (Burke-Spolaor et al. 2019). Therefore, observational evidence for the existence of such binaries has important IPTA implications (Goulding et al. 2019).
The binary black hole (BBH) central engine description for the bright blazar OJ 287 provides the most promising scenario for the existence of a nano-Hz GW emitting massive BH binary (Dey et al. 2019). The model naturally explains the observed double-peaked high brightness flares (outbursts) from OJ 287 and predicts the arrival time of future outbursts. These flares arise due to the impact of an orbiting secondary BH onto the accretion disk of the primary. In the resulting thermal flares, flux densities (hereafter "flux") in the UV–infrared wavelengths increase sharply within just a day or so and then fall off more slowly in the following days (Valtonen et al. 2019). Accurate timing of these flares allows us to track the general relativistic trajectory of the secondary BH and to determine BBH central engine parameters (Dey et al. 2018, hereafter D18).
The nature of such flares and the method of predicting future flares were detailed by Lehto & Valtonen (1996) and Sundelius et al. (1997). In their model, the secondary BH plunges through the accretion disk twice per orbit, which ensures two flares per period. This model also predicted that impact flares should be thermal, with a nearly flat bremsstrahlung spectrum, rather than the ubiquitous synchrotron flares with a power-law spectrum. It was not a trivial prediction, as no bremsstrahlung flares had been observed in any blazar up to that time. The observations of the 2005 November flare confirmed this prediction (Valtonen et al. 2006, 2008a, 2012). This was followed by a successful observational campaign, launched to monitor the predicted pericenter flare of 2007 (Valtonen et al. 2008b). These observations demonstrated the importance of incorporating the effects of quadrupolar order GW emission while predicting the impact flare epochs from the blazar. Further, the successful observation of OJ 287's 2015 apocenter impact flare, predicted by Valtonen et al. (2011), provided an estimate for the spin of its primary BH (Valtonen et al. 2016). The present BBH model, extracted from the accurate timing of 10 flares between 1913 and 2015 (D18), is specified by the following parameters: primary with mass 1.835 × 10¹⁰ M⊙ and Kerr parameter a = 0.38, and a 1.5 × 10⁸ M⊙ secondary in an eccentric (e ∼ 0.65) orbit with a redshifted orbital period of 12 yr.
D18 predicted that the next impact flare from OJ 287 should peak in the early hours of 2019 July 31, UT, within a specified time interval of ±4.4 hr (Eddington flare). This prediction is fairly unique as there are no free parameters whose value can be constrained from the actual observations of the flare, in contrast to the earlier flares. Ideally, we would have launched a ground-based optical observational campaign to monitor the predicted Eddington flare. However, OJ 287 was at a solar elongation <5° during the peak of the flare. Therefore, there was no option to confirm it by means of a ground-based observing campaign. The Spitzer Space Telescope, operating at infrared wavelengths, turned out to be the best substitute for optical monitoring. An earlier optical/infrared campaign was organized for flux normalization. In what follows, we explain why we are confident about the presence of the predicted Eddington flare in our Spitzer data and state its implications.
2. BBH Central Engine of OJ 287 and Its 2019 Prediction
The 130 yr long optical lightcurve of OJ 287 reveals two prominent outbursts every 12 yr (Dey et al. 2019). The outburst timings are consistent with a scenario in which biorbital secondary BH impacts generate a hot bubble of plasma on each side of the primary BH accretion disk. These bubbles expand and eventually become optically thin. At this epoch, the radiation from the entire bubble volume is released and we observe a big thermal flare. In the model, the observed steeply rising flux during a flare arises from an increase in the visible radiating volume, while the declining flux comes with the decreasing temperature from the associated adiabatic expansion. Both processes should produce radiation that is wavelength independent while timing various epochs of the flare.
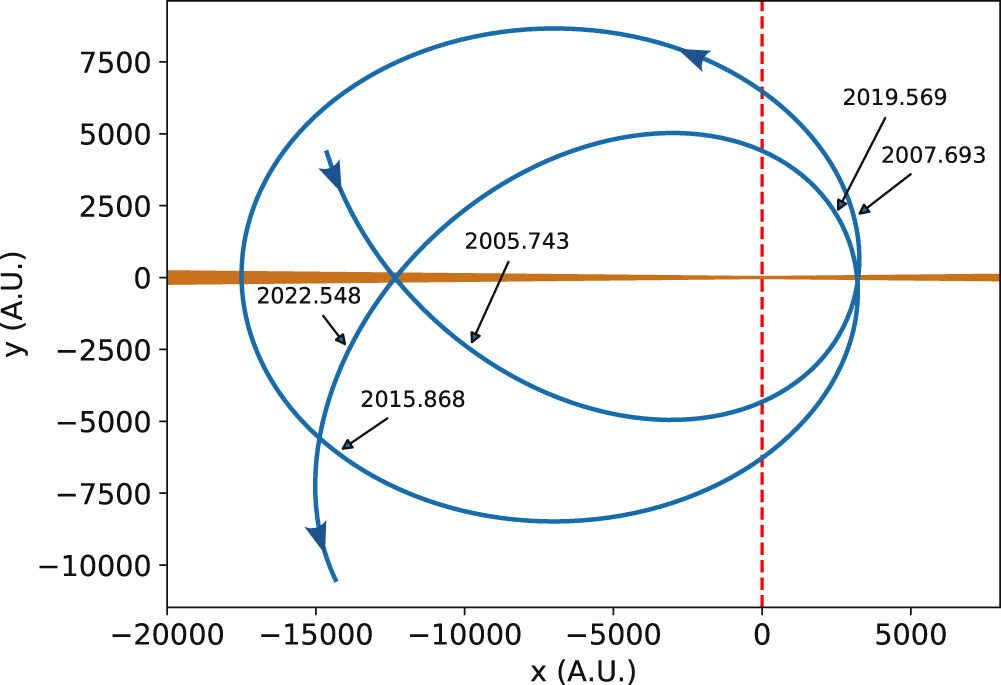
In general, the points of impact are located at different distances from the primary due to the general relativity (GR) induced pericenter advance (Lehto & Valtonen 1996). However, there are occasions during which two impacts happen close to the pericenter of such a relativistic orbit. We expect that the astrophysical conditions are fairly similar at such impacts, leading to essentially similar flares. The orbit solution of D18 shows a pair of pericenter flares during 2007 September 14 and 2019 July 31 (Figure 1). This allowed us to use the observed optical lightcurve of the 2007 outburst as a template to analyze our Spitzer observations of OJ 287 during late July and early August of 2019.

Figure 1. General relativistic orbit of the secondary BH in OJ 287 during the 2005–2023 window (D18). The primary BH is situated at the origin with its accretion disk in the y = 0 plane. The impacts that caused the 2007 and 2019 outbursts happen to originate roughly from the same location of the disk near the pericenter, and the secondary BH follows similar trajectories, leading to fairly identical lightcurves. In contrast, the 2005 and 2022 impact flare lightcurves are expected to be different. The orbit is calculated using our PN accurate binary BH description.
Download figure:
Standard image High-resolution imageA post-Newtonian (PN) approximation to GR is employed to track the secondary BH orbit around the primary BH (Will & Maitra 2017). We incorporate higher-order corrections to both the conservative and reactive contributions to the relative acceleration  (see Equation (1) in D18). Crucially, these corrections involve certain GW-emission-induced
  contributions due to the scattering of quadrupolar GWs from the spacetime curvature created by the total mass (monopole) of the system (Blanchet & Schafer 1993; D18). Additionally, we incorporate various spin-induced contributions to
  that arise from general relativistic spin–orbit and the classical spin–orbit interactions. The latter contributions depend on the quadrupole moment of the primary BH and affect the expected outburst time of the Eddington flare. Therefore, the accurate determination of the epoch of this flare has the potential to constrain the celebrated BH no-hair theorem (Valtonen et al. 2011; D18). This is because the theorem allows us to connect the scaled quadrupole moment q2 and the Kerr parameter χ of the primary BH by

where q should be unity in GR (Thorne 1980) and therefore testable with present observations.
3. Observations and Implications of the 2019 Outburst
3.1. Spitzer Observations and Data Reduction
Visibility and scheduling constraints did not permit Spitzer (Werner et al. 2004) to observe OJ 287 until 2019 July 31, 15 UT, several hours after the predicted time window for the occurrence of the impact flare peak. Therefore, we focused on the declining part of the expected flare where the radiating bubbles are optically thin in all relevant wavebands (Valtonen et al. 2019). This part lies between the first brightness peak and the first major minimum, predicted to occur during 2019 August 7. The Spitzer scheduling permitted dense monitoring during this critical period. Altogether OJ 287 was observed with Spitzer's Infrared Array Camera (Fazio et al. 2004) on 21 epochs between 2019 July 31 and 2019 September 6. The cadence was approximately 12 hr for the first five epochs, then once per day for the next eight epochs, and thereafter approximately twice a week for the last eight epochs. Additionally, OJ 287 was monitored on five epochs between 2019 February 25 and 2019 March 2 with daily cadence for normalization purposes with simultaneous optical observations. February–March observations permitted us to convert the infrared Spitzer/IRAC channel-1 (3.6 μm) and channel-2 (4.5 μm) flux densities, observed during the flare, to equivalent R-band flux densities. These observations were taken as part of the Spitzer DDT program pid 14206. The observing log and reduced flux densities are given in Table 1.
Table 1. Multi-epoch Spitzer Observations in 3.6 μm (Ch-1) and 4.5 μm (Ch-2) Wavelength Bands and the Ground-based Observations in the Optical R-band
| Epoch (UT) | Ch-1 Flux (mJy) | Ch-2 Flux (mJy) | R-band Flux (mJy) |
|---|---|---|---|
| 2019 Feb 25 23:23:06.905 | 17.8 ± 0.1 | 21.8 ± 0.1 | 2.836 ± 0.005 |
| 2019 Feb 26 22:02:51.370 | 17.7 ± 0.1 | 21.6 ± 0.1 | 2.825 ± 0.005 |
| 2019 Feb 28 01:21:52.252 | 18.2 ± 0.1 | 22.6 ± 0.1 | 2.881 ± 0.003 |
| 2019 Mar 1 01:01:21.123 | 17.3 ± 0.1 | 21.2 ± 0.1 | 2.875 ± 0.011 |
| 2019 Mar 2 01:39:00.677 | 17.0 ± 0.1 | 20.8 ± 0.1 | 2.825 ± 0.013 |
| 2019 Jul 31 15:25:33.651 | 26.3 ± 0.1 | 32.3 ± 0.1 | ⋯ |
| 2019 Aug 1 07:53:36.630 | 26.0 ± 0.1 | 31.7 ± 0.1 | ⋯ |
| 2019 Aug 1 16:04:46.053 | 26.5 ± 0.2 | 32.0 ± 0.1 | ⋯ |
| 2019 Aug 2 02:03:48.230 | 25.5 ± 0.1 | 31.0 ± 0.1 | ⋯ |
| 2019 Aug 2 18:44:48.833 | 24.7 ± 0.1 | 30.0 ± 0.1 | ⋯ |
| 2019 Aug 3 15:41:47.976 | 25.7 ± 0.1 | 31.3 ± 0.1 | ⋯ |
| 2019 Aug 4 15:15:32.277 | 24.5 ± 0.1 | 29.9 ± 0.1 | ⋯ |
| 2019 Aug 5 14:21:42.642 | 23.8 ± 0.2 | 28.9 ± 0.1 | ⋯ |
| 2019 Aug 6 12:09:24.649 | 23.5 ± 0.2 | 28.9 ± 0.1 | ⋯ |
| 2019 Aug 7 13:10:27.952 | 23.6 ± 0.1 | 29.0 ± 0.1 | ⋯ |
| 2019 Aug 8 19:12:35.339 | 24.0 ± 0.1 | 29.2 ± 0.1 | ⋯ |
| 2019 Aug 9 12:52:32.488 | 24.0 ± 0.1 | 29.6 ± 0.1 | ⋯ |
| 2019 Aug 10 19:13:55.542 | 24.3 ± 0.1 | 29.8 ± 0.1 | ⋯ |
| 2019 Aug 13 07:03:26.024 | 23.5 ± 0.1 | 28.8 ± 0.1 | ⋯ |
| 2019 Aug 16 21:11:01.225 | 23.0 ± 0.1 | 28.5 ± 0.1 | ⋯ |
| 2019 Aug 20 18:12:49.690 | 24.3 ± 0.1 | 29.7 ± 0.1 | ⋯ |
| 2019 Aug 22 19:27:51.842 | 23.9 ± 0.1 | 29.3 ± 0.1 | ⋯ |
| 2019 Aug 25 01:46:53.100 | 25.0 ± 0.2 | 30.6 ± 0.1 | ⋯ |
| 2019 Aug 28 02:42:37.747 | 22.9 ± 0.1 | 28.4 ± 0.2 | ⋯ |
| 2019 Sep 2 21:10:17.922 | 22.3 ± 0.1 | 27.7 ± 0.1 | ⋯ |
| 2019 Sep 4 05:44:12.19 | ⋯ | ⋯ | 2.918 ± 0.007 |
| 2019 Sep 5 02:44:00.96 | ⋯ | ⋯ | 3.179 ± 0.092 |
| 2019 Sep 5 02:52:00.48 | ⋯ | ⋯ | 3.138 ± 0.080 |
| 2019 Sep 6 01:47:09.46 | ⋯ | ⋯ | 3.313 ± 0.060 |
| 2019 Sep 6 17:43:11.593 | 23.7 ± 0.1 | 29.8 ± 0.2 | ⋯ |
Note. Times are in UT and reflect the start of the observation in Ch-2. The Ch-1 observations started after the Ch-2 observations were done, about 2 minutes and 10 s after the start of the Ch-2 observations typically. The R-band flux observations are not exactly simultaneous with the Spitzer observations but at very close epochs (within 2 hr).
Download table as: ASCIITypeset image
All of the observations were taken both in the 3.6 and 4.5 μm channels (corresponding approximately to the conventional photometric L- and M-bands) using the 2 s frame time with a 10-position medium-scale dither (typical dither amplitudes of less than an arcminute). The same dither starting point was used in every observation so that OJ 287 landed roughly on the same pixel position in each observation and dither offset.
The corrected basic calibrated data frames were inspected by eye, and remaining artifacts, such as column pulldown, were removed with the imclean tool.29 Frames with a cosmic-ray detection within a 10-pixel (approximately 12'') radius of OJ 287 were not included in the analysis (in general there were zero to one such frames per observation). The centroid of the image of OJ 287 was found with the first moment centroiding method.30 We performed aperture photometry with the IDL procedure aper using a source aperture radius of six pixels and a background annulus between 12 and 20 pixel radial distance from the centroid position. We corrected the flux densities with the irac_aphot_corr.pro procedure,31 for the pixel phase and array location-dependent response functions. In addition, we performed an aperture correction as tabulated in the IRAC Instrument Handbook.32 For each channel, at each epoch, we finally calculated the mean flux density and the uncertainty from the standard error of the mean, as presented in Table 1.
3.2. Extracting the Presence of the Impact Flare and Its Implications
Recall that we predicted the optical R-band lightcurve for the 2019 impact flare from the corresponding observations in 2007. However, our observations of the Eddington flare are in the two near-infrared Spitzer channels. Therefore, it is crucial to estimate how the predicted flare lightcurve should look in the Spitzer bands. In the quiescent state, the infrared–optical wavelength emission comes from synchrotron radiation, and the spectrum follows a power law with a spectral index α ∼ −0.95 (Kidger et al. 2018). In contrast, BH impact flares are dominated by bremsstrahlung radiation, which has a nearly flat spectrum in the near-infrared–optical wavelengths superposed on the usual synchrotron emission. Therefore, we expect that the impact-induced fluxes in the Spitzer bands will be similar to those in the optical bands. However, the base levels of the fluxes in the Spitzer and optical wavelengths should be different during such outbursts due to the steep power-law spectrum of the synchrotron background. Therefore, we subtract the base-level fluxes from the observed Spitzer band fluxes during the outburst to compare with the predicted R-band flux curve. We expect the 2019 impact flare to be coincident in time in the optical and the near-infrared as multiwavelength observations of the 2015 impact flare show no time delay across the relevant wavebands (Valtonen et al. 2016; Kushwaha et al. 2018).
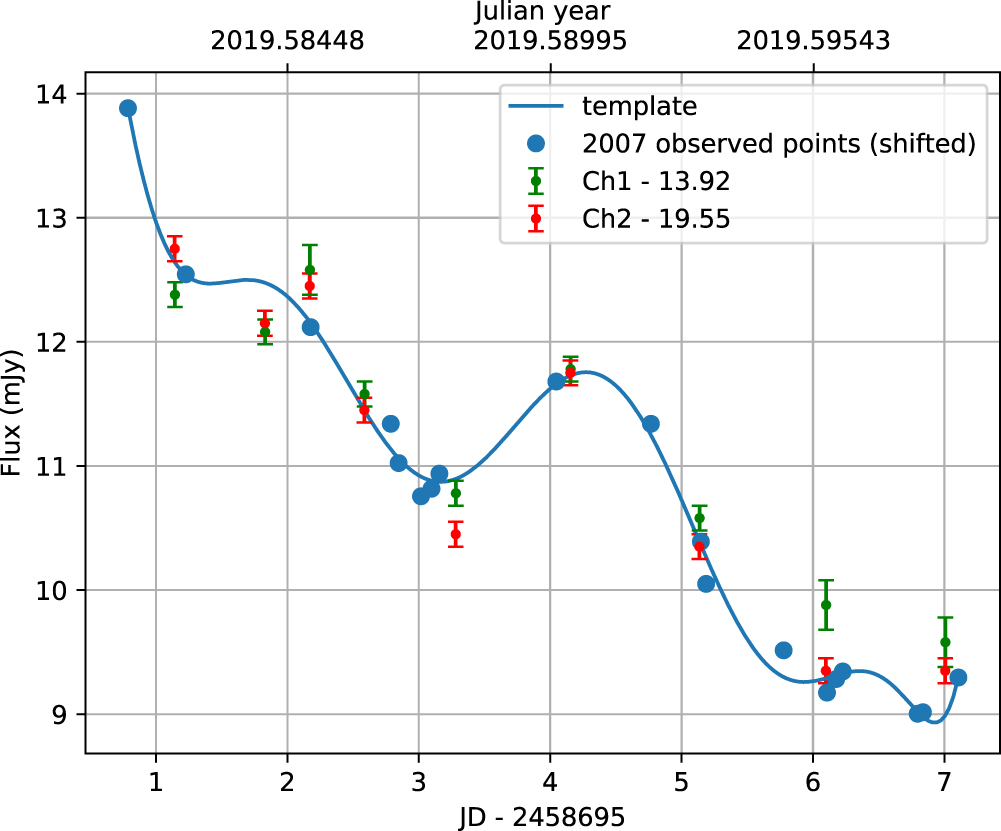
We now examine if our observed Spitzer lightcurve does contain the predicted impact flare. This requires us to create a template of the expected flare, as given in Figure 2, and we focus on the declining part after the first peak which lasts around 7 days. The template is obtained by fitting a polynomial to the observed R-band lightcurve of the 2007 flare (Valtonen & Sillanpää 2011), shifted forward by 11.8752 yr. This time shift between the 2007 and 2019 flares, with ±4 hr uncertainty, was previously found in the orbit solution (D18). We introduce the three parameters Δt, ΔF1, and ΔF2 for fitting the Spitzer data with the outburst template. The parameters ΔF1 and ΔF2 are used to correct for the expected base-level differences between R-band and Spitzer's Ch-1 and Ch-2 fluxes, respectively. The Δt parameter allows us to find the difference between the predicted and actual arrival times of the 2019 outburst. Note that it shifts the time variable in our polynomial fit for the 2007 lightcurve. We employ only a single Δt parameter for both channels as we expect the impact flare to produce simultaneous flux variations in both channels. The best-fit values with 1σ uncertainties read Δt = −0.06 ± 0.05 days, ΔF1 = 13.92 ± 0.11 mJy, and ΔF2 = 19.55 ± 0.09 mJy. This implies that the Eddington flare arrived 1.4 ± 1.2 hr late of the predicted epoch but well within the expected time interval. Therefore, we shift our flux templates forward in time by 0.06 days to obtain Figure 2 where we compare the base-level corrected flux variations in Spitzer channels with the template of 2007. We also performed a self-consistency test by fitting the Ch-1 and Ch-2 fluxes separately, and the resulting values of Δt's for the two channels agree with each other within their uncertainties, as required. Qualitatively, the predicted lightcurve template for the 2019 impact outburst matches fairly well with the base-level corrected fluxes of both Spitzer channels. To quantify these similarities, we computed Pearson's r between the observed Spitzer data sets and the time-corrected template of Figure 2 and found high correlations (Pearson's r ∼ 0.98). We repeated this analysis using 20,000 random 1 week long OJ 287 lightcurves to rule out the occurrence of high Pearson's r values due to chance coincidences.

Figure 2. Observed Spitzer flux variations of OJ 287 during 2019 July 31 to 2019 August 6 (green and red points with the error bars provide the base-level corrected fluxes in the two near-infrared Spitzer channels). Solid line connects the multi-epoch optical observations (blue filled circles) of the 2007 impact flare, shifted by the predicted  yr time interval. The temporal shift of our 2007 template does incorporate the fact that the observed flare came 0.06 days later than our prediction. The template is given by a ninth-order polynomial that minimally and smoothly fits the 2007 optical data. An apparent agreement does exist between our prediction and observations.
Download figure:
Standard image High-resolution imageIt turns out that the possible template choices introduce ∼1 hr uncertainty in the flare timing. The template curve of Figure 2 should actually be a Gaussian band instead of a single line, since there is always some background noise in the source, and because the 2007 observations have associated error bars. Instead of a single template curve there could be any number of alternative ones that fit inside the band of ±0.3 mJy vertical half-width. Repeating the above processes with this band instead of a single line widens the error bars in ΔF but has no effect on Δt beyond the 1 hr additional error. Further, the radiating bubble that emits bremsstrahlung with a Maxwellian velocity distribution can give the spectral index α ∼ −0.2, rather than 0.0, the exactly flat spectrum (intensity ∼ να) if the source has a constant temperature T (Karzas & Latter 1961). However, when we are looking at an expanding bubble, the light travel time is different from different parts of the source, and therefore the spectrum is composed of contributions from different temperatures T within some range ΔT. The intensity depends essentially only on the parameter u = hν/kT. If we employ a reasonable assumption that temperatures T are uniformly distributed over this range, then the intensity is constant over the corresponding range in frequency Δν and we get a flat emission spectrum. Naturally, details depend on the models of the emitting bubble (Pihajoki 2016). It is likely that the spectral index α lies between −0.2 and 0.0. For α = −0.2, we get Δt = 0.10 ± 0.05 implying that the flare arrived 2.5 ± 1.2 hr early. Thus, considering these uncertainties, the Eddington flare came within ∼4 hr of the predicted time.
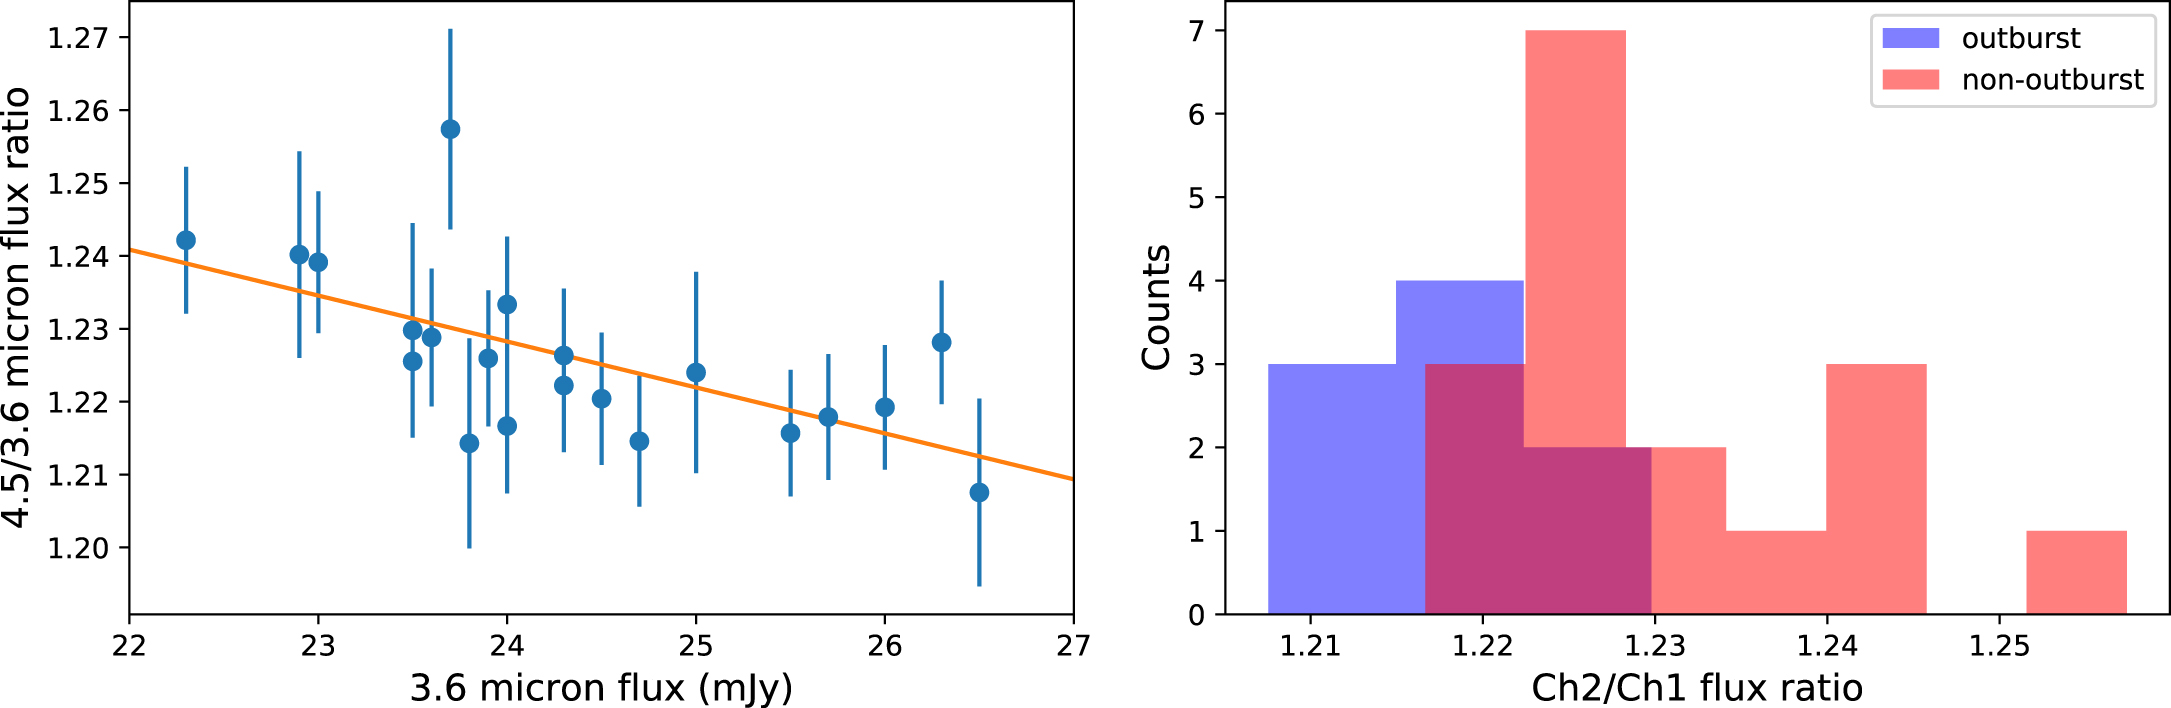
The nearly flat spectrum of the impact flare should cause an overall decrease in the ratio of 4.5 and 3.6 μm fluxes in the neighborhood of flare peak in Spitzer data. Plots in Figure 3 confirm this expectation. The flux ratios during the outburst window from 2019 July 31 to August 6 have a significantly different distribution with smaller values compared to their counterparts during the non-outburst phases. Further, we got a Kolmogorov–Smirnov (K-S) statistic of 0.66 with a p-value = 0.0053 while doing the K-S test between the two set flux ratios. At this significance level, the flux ratios during the outburst and non-outburst epochs come from two distinct distributions.

Figure 3. Left panel: we display the flux ratio between the 4.5 and 3.6 μm Spitzer channels against the 3.6 μm flux, which shows the expected decrease in the ratio when the flux is high. Right panel: distribution of the above flux ratio during outburst and non-outburst stretches of data. The bremsstrahlung nature of the flare is responsible for the small flux ratio during flare epochs.
Download figure:
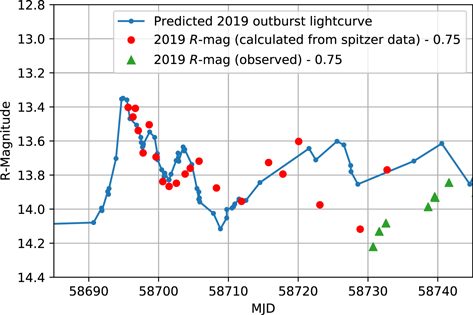
Standard image High-resolution imageIt is also possible to construct a fiducial R-band magnitude flare lightcurve from Spitzer data using the calibration measurements that involved both optical R-band and the Spitzer channels during 2019 February 25–2019 March 2. We find that the Ch-1 flux can be converted to an equivalent optical R-band value by dividing the former by ∼6.2 and for Ch-2 the factor is ∼7.6. Therefore, using the previously obtained base-level contributions to the infrared flux, the R-band base flux during the 2019 impact flare should be ∼3.73 mJy. Thereafter, this R-band flux is added to the excess flux above the base level in the two Spitzer bands. The resulting two fluxes are averaged at every epoch and converted to R magnitudes (using the Gemini observatory converter). This is plotted in Figure 4, together with the actual ground-based R-band observations. Indeed, the fiducial R-band magnitudes join smoothly with the direct R-band observations in early September where both Spitzer and optical observations overlap. These plots endorse the similar nature of 2007 and 2019 flares both in their total sizes and general lightcurve shapes.
Figure 4. Reconstructed R-band lightcurve (red points) and actual R-band observation (green triangles) along with the prediction (blue line with dots; D18). The red R-band points are constructed from the associated Spitzer fluxes after subtracting the measured 2019 August 16 fluxes as the synchrotron base level and adding our estimated R-band base-level flux of ∼3.73 mJy. Also, we consider α = −0.2 while converting the Spitzer fluxes to R-band fluxes.
Download figure:
Standard image High-resolution image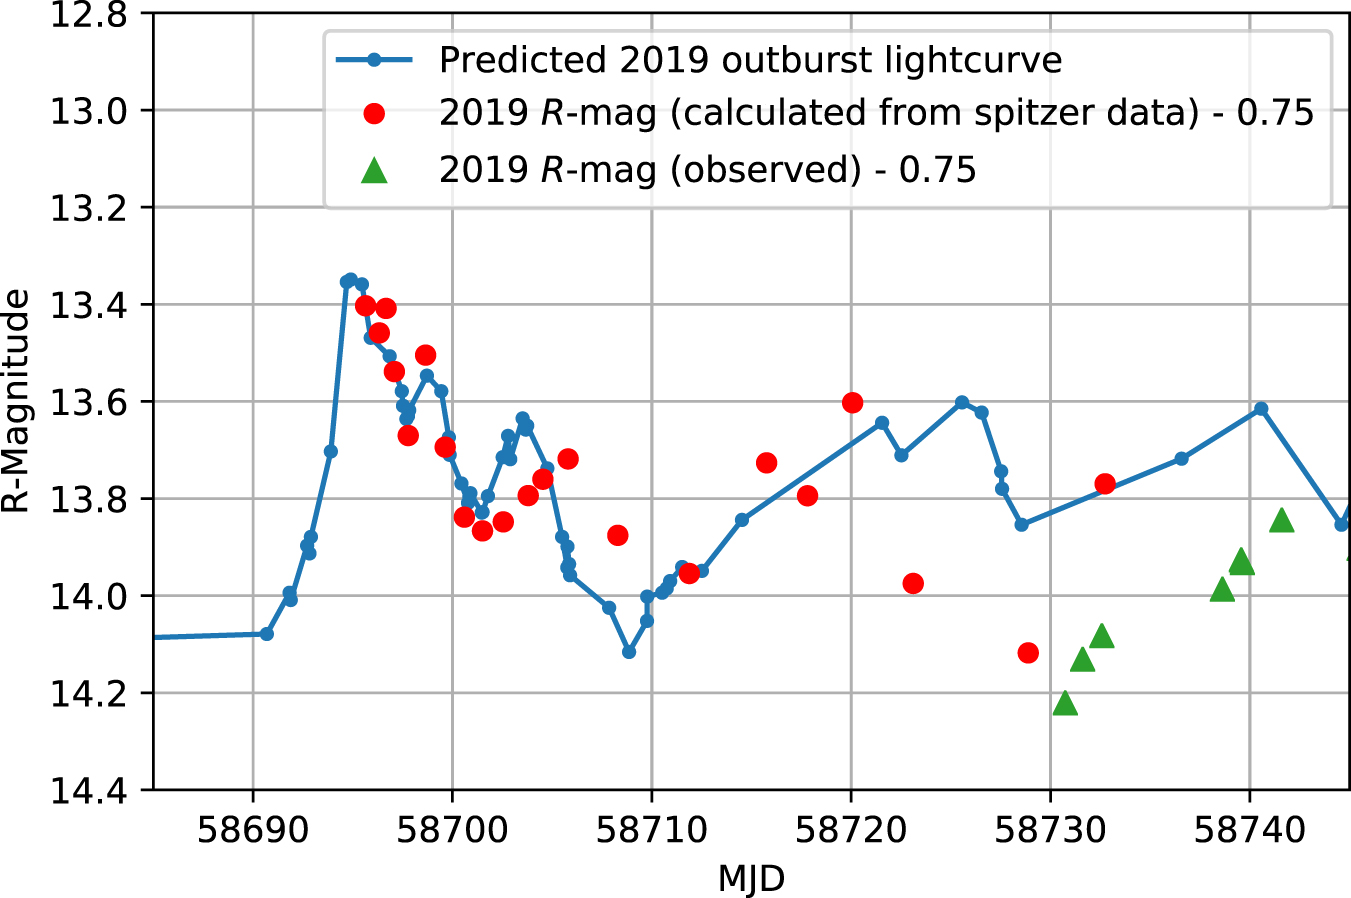
4. Discussion
We presented observational evidence and astrophysical arguments for the occurrence of an impact flare during 2019 July 31 in OJ 287 that was predicted using the BBH central engine model. These efforts confirm OJ 287 as a source of nano-Hz GWs, which should provide additional motivation for probing the IPTA data sets for GWs from massive BH binaries in general relativistic eccentric orbits (Susobhanan et al. 2020). The present analysis underlines the importance of incorporating the effects of higher-order GW emission in the model. Interestingly, we would have predicted the flare to occur 1.5 days earlier than it did if we included only the dominant quadrupolar order GW emission in the BBH dynamics. Observational evidence for the flare arrival within 4 hr of the actual prediction supports the prominent role of including 2PN-accurate GW emission effects while tracking the orbit of the secondary BH. More importantly, our Spitzer observations constrain the celebrated no-hair theorem by bounding the parameter q in Equation (1). The above-mentioned timing accuracy corresponds to q = 1.0 ± 0.15 (D18), in agreement with the GR value q = 1.0, provided identical impacts generate identical flares, and that the higher-order GW emission is calculated accurately enough. Such accuracy is possible as our Spitzer observations cover the crucial epoch of fast decline in the flux where the shape of the lightcurve is essentially wavelength independent, which allowed us to tie the variability timescale to the 130 yr long record at optical wavelengths. These observations are setting the stage for observational campaigns that employ the unprecedented high-resolution imaging capabilities of the Event Horizon Telescope, in combination with the Global Millimeter VLBI Array and the space VLBI mission RadioAstron, to spatially resolve the BBH system in OJ 287.
We thank Sean Carey for useful discussions on Spitzer data. This work is based in part on observations made with the Spitzer Space Telescope, which is operated by the Jet Propulsion Laboratory, California Institute of Technology under a contract with NASA. L.D. and A.G. acknowledge support of the Department of Atomic Energy, Government of India, under project No. 12-R&D-TFR-5.02-0200. S.Z. acknowledges grant No. NCN 2018/29/B/ST9/01793.
Footnotes
- 29
- 30
- 31
- 32